
Effective training is key to build a strong foundation for competition. That’s why I am using the Strava API with Python to analyze Strava training activities. I started my winter training recently and wanted to make sure I’m training effectively. Especially, I want to see if I stay in the right zones during the training. I have set up my Forerunner alarms appropriate, but I train outdoor, so it goes up and down during the run and I can’t control everything during the ride. Human. Not robot.
I started with the stravalib library, for reading the data from the API. As usual in data science, I need to transform and prepare the data for visualization. I end up storing the generated plots and build a quick & dirty HTML-file to display the stuff. I will now guide you through the example. I will explain the important steps. You can find the complete code on https://github.com/marquies/strava-viz.
The basic mechanics to get access
At first, I struggled with the stravalib. I found a nice working example Ryan Baumann’s blog post “Strava API – Cycling Data for Visualization” (#kudos).
Strava uses OAuth to gain 3rd party services access to the user’s data. It involves that the service calls Strava with a pre-generated client ID (and with a callback URL), the user authenticates at Strava, Strava redirects the browser back to the service with an access token. Therefore you need a web server. Thankfully Python comes with a suitable system.
The Client ID (and secret) need to be generated, you can do this in your Strava settings page. Store the client ID and the access token in a file named ‘client.secret’ next to the script (clientid:token). Let’s start with the script. In line 327, the client.secret file get’s read and prepared to generate the authorization URL on line 331. Next, the script opens the URL in a local browser window. The OAuth process starts and in the meantime, the local web server starts to process requests. The browser gets redirected to the local server, which processes the requests and starts the access to the API. The browser window can be closed.
#!/usr/bin/python
# -*- coding: utf-8 -*-
import stravalib
import http.server
import urllib.parse
import webbrowser
import pandas as pd
import matplotlib.pyplot as plt
import numpy as np
import os
from mpl_toolkits.axes_grid1 import host_subplot
import mpl_toolkits.axisartist as AA
# -----------------------------------------------------------------------------
# *** Setup Section ***
# -----------------------------------------------------------------------------
# Port of the webserver
port = 5000
# Output Directory
out_dir = './out/'
# Initialize helper Vars
# limiter of the number of activities requested
limit = 25
# Create redirect URL
url = 'http://localhost:%d/authorized' % port
# List of available types:
# https://pythonhosted.org/stravalib/api.html?highlight=get_activity_streams#stravalib.client.Client.get_activity_streams
types = ['time', 'heartrate', 'velocity_smooth', 'cadence']
# -----------------------------------------------------------------------------
# Functions and Classes
# -----------------------------------------------------------------------------
# Define the web functions to call from the strava API
def UseCode(code):
# Retrieve the login code from the Strava server
access_token = client.exchange_code_for_token(client_id=client_id,
client_secret=secret,
code=code)
# Now store that access token somewhere (for now, it's just a local
# variable)
client.access_token = access_token
athlete = client.get_athlete()
print("For %(id)s, I now have an access token %(token)s" %
{'id': athlete.id, 'token': access_token})
return client
def GetActivities(client, limit):
# Returns a list of Strava activity objects, up to the number specified
# by limit
activities = client.get_activities(limit=limit)
assert len(list(activities)) == limit
return activities
def GetStreams(client, activity, types):
# Returns a Strava 'stream', which is timeseries data from an activity
streams = client.get_activity_streams(activity,
types=types, series_type='time')
return streams
def DataFrame(dict, types):
# Converts a Stream into a dataframe, and returns the dataframe
# print(dict, types)
df = pd.DataFrame()
for item in types:
if item in dict.keys():
df.append(item.data)
df.fillna('', inplace=True)
return df
def ParseActivity(act, types):
act_id = act.id
name = act.name
# print(str(act_id), str(act.name), act.start_date)
streams = GetStreams(client, act_id, types)
df = pd.DataFrame()
# Write each row to a dataframe
for item in types:
if item in streams.keys():
df[item] = pd.Series(streams[item].data, index=None)
df['act_id'] = act.id
df['act_startDate'] = pd.to_datetime(act.start_date)
df['act_name'] = name
return df
def convMs2Kmh(speed):
# Convert m/s in km/h
return speed / 1000 / (1 / 3600)
def prepareOneActivity(my_data, dir):
# Prepare the heartrate data for barplot
counts = [0, 0, 0, 0, 0]
data = my_data['heartrate']
for point in data:
if (point < 137):
counts[0] += 1
elif (point >= 137 and point < 151):
counts[1] += 1
elif (point >= 151 and point < 165):
counts[2] += 1
elif (point >= 165 and point < 172):
counts[3] += 1
elif (point > 179):
counts[4] += 1
tmp = counts
total = sum(tmp)
counts = [(1. * x / total) * 100 for x in tmp]
# Prepare the various data for boxplots
hfrq_by_zones = [[], [], [], [], []]
cadz_by_zones = [[], [], [], [], []]
velo_by_zones = [[], [], [], [], []]
my_list = list()
my_list.append(list(my_data['heartrate']))
my_list.append(list(my_data['velocity_smooth']))
if ('cadence' in my_data):
my_list.append(list(my_data['cadence']))
else:
my_list.append([0] * my_data['velocity_smooth'])
my_array = zip(*my_list)
for hr, vs, cd in my_array:
vs = convMs2Kmh(vs)
if (hr < 137):
hfrq_by_zones[0].append(hr)
cadz_by_zones[0].append(cd)
velo_by_zones[0].append(vs)
elif (hr >= 137 and hr < 151):
hfrq_by_zones[1].append(hr)
cadz_by_zones[1].append(cd)
velo_by_zones[1].append(vs)
elif (hr >= 151 and hr < 165):
hfrq_by_zones[2].append(hr)
cadz_by_zones[2].append(cd)
velo_by_zones[2].append(vs)
elif (hr >= 165 and hr < 172):
hfrq_by_zones[3].append(hr)
cadz_by_zones[3].append(cd)
velo_by_zones[3].append(vs)
elif (hr > 179):
hfrq_by_zones[4].append(hr)
cadz_by_zones[4].append(cd)
velo_by_zones[4].append(vs)
# -----------------------------------------------------------------------------
# Prepare bar plot of number of values in the zone
# -----------------------------------------------------------------------------
objects = ('S', 'GA1', 'GA2', 'EB', 'SB')
y_pos = np.arange(len(objects))
plt.figure()
plt.bar(y_pos, counts, align='center', alpha=0.5)
plt.xticks(y_pos, objects)
plt.ylabel('Percentage of activity')
plt.xlabel('Zones')
plt.title('Heartrate Zones')
plt.ylim([0, 100])
plt.savefig(dir + '/' + '1.png')
# -----------------------------------------------------------------------------
# Prepare the bar plot combined with boxplot of velocity & cadence
# -----------------------------------------------------------------------------
data_len = [int(i) for i in counts]
plt.figure()
host = host_subplot(111, axes_class=AA.Axes)
plt.subplots_adjust(right=0.75)
ax2 = host.twinx()
ax3 = host.twinx()
offset = 60
new_fixed_axis = ax3.get_grid_helper().new_fixed_axis
ax3.axis["right"] = new_fixed_axis(loc="right", axes=ax3,
offset=(offset, 0))
ax2.axis["right"].toggle(all=True)
ax2_min = -100
ax2_max = 175
ax3_min = 0
ax3_max = 100
host.set_ylim([0, 100])
ax2.set_ylim([ax2_min, ax2_max])
ax3.set_ylim([ax3_min, ax3_max])
host.set_xlabel("Zones")
host.set_ylabel("Percentage of activity")
ax2.set_ylabel("Cadence")
ax3.set_ylabel("Velocity")
host.bar(range(1, len(data_len) + 1), data_len, align='center',
color="lightgrey")
bp1 = ax2.boxplot(cadz_by_zones, widths=0.6)
bp2 = ax3.boxplot(velo_by_zones, widths=0.6)
ax2.axis["right"].label.set_color("red")
ax3.axis["right"].label.set_color("blue")
host.set_xticklabels(objects, rotation='vertical')
# major ticks every 20, minor ticks every 5
ax2_major_ticks = np.arange(ax2_min, ax2_max, 20)
ax2_minor_ticks = np.arange(ax2_min, ax2_max, 5)
ax2.set_yticks(ax2_major_ticks)
ax2.set_yticks(ax2_minor_ticks, minor=True)
ax3_major_ticks = np.arange(ax3_min, ax3_max, 20)
ax3_minor_ticks = np.arange(ax3_min, ax3_max, 5)
ax3.set_yticks(ax3_major_ticks)
ax3.set_yticks(ax3_minor_ticks, minor=True)
for box in bp1['boxes']:
box.set(color='red', linewidth=1)
for box in bp2['boxes']:
box.set(color='blue', linewidth=1)
plt.savefig(dir + '/' + '2.png')
# -----------------------------------------------------------------------------
# Setup
# -----------------------------------------------------------------------------
plt.figure()
fig, axes = plt.subplots(nrows=1, ncols=2, figsize=(9, 4))
bplot1 = axes[0].boxplot(hfrq_by_zones, vert=True, patch_artist=True)
bplot2 = axes[1].boxplot(data, vert=True, patch_artist=True)
colors = ['pink', 'lightblue', 'lightgreen']
for bplot in (bplot1, bplot2):
for patch, color in zip(bplot['boxes'], colors):
patch.set_facecolor(color)
axes[0].yaxis.grid(True)
axes[1].yaxis.grid(True)
axes[0].set_xticks([y + 1 for y in range(len(hfrq_by_zones))], )
axes[0].set_xlabel('Zones')
axes[0].set_ylabel('Heartrate')
axes[0].set_ylim([100, 230])
axes[1].set_ylim([100, 230])
plt.setp(axes[0], xticks=[y + 1 for y in range(len(hfrq_by_zones))],
xticklabels=objects)
plt.setp(axes[1], xticks=[1],
xticklabels=["All"])
# -----------------------------------------------------------------------------
# Display the plot windows
# -----------------------------------------------------------------------------
plt.savefig(dir + '/' + '3.png')
class MyHandler2(http.server.BaseHTTPRequestHandler):
# Handle the web data sent from the strava API
allDone = False
data = {}
def do_HEAD(self):
return self.do_GET()
def do_GET(self):
# Get the API code for Strava
# self.wfile.write('<script>window.close();</script>')
code = urllib.parse.parse_qs(
urllib.parse.urlparse(self.path).query)['code'][0]
# Login to the API
client = UseCode(code)
# Retrieve the last limit activities
activities = GetActivities(client, limit)
for item in activities:
print(item.name)
# Loop through the activities, and create a dict of the dataframe
# stream data of each activity
print("looping through activities...")
df_lst = {}
for act in activities:
df_lst[act.start_date] = ParseActivity(act, types)
MyHandler2.data = df_lst
MyHandler2.allDone = True
# -----------------------------------------------------------------------------
# *** Run Section ***
# -----------------------------------------------------------------------------
# -----------------------------------------------------------------------------
# Request access via local browser
# -----------------------------------------------------------------------------
client_id, secret = open('client.secret').read().strip().split(',')
# Create the strava client, and open the web browser for authentication
client = stravalib.client.Client()
authorize_url = client.authorization_url(client_id=client_id, redirect_uri=url)
print('Opening: %s' % authorize_url)
webbrowser.open(authorize_url)
# -----------------------------------------------------------------------------
# Start webserver and wait for redirect local browser
# -----------------------------------------------------------------------------
httpd = http.server.HTTPServer(('localhost', port), MyHandler2)
while not MyHandler2.allDone:
print(MyHandler2.allDone)
httpd.handle_request()
# -----------------------------------------------------------------------------
# Data preparation
# -----------------------------------------------------------------------------
# if os.path.exists(out_dir):
#    os.remove(out_dir)
os.makedirs(out_dir)
html_str = """
<table border=1>
<tr>
<th>Name</th>
<th>1</th>
<th>2</th>
<th>3</th>
</tr>
<indent>
"""
name_counter = {}
for act in iter(MyHandler2.data.values()):
if (len(act['act_name']) > 0 and ('heartrate' in (act))):
if act['act_name'][0] in name_counter:
name_counter[act['act_name'][0]] += 1
act['act_name'][0] = act['act_name'][0] + str(name_counter[
act['act_name'][0]])
else:
name_counter[act['act_name'][0]] = 0
for act in iter(MyHandler2.data.values()):
if (len(act['act_name']) > 0 and ('heartrate' in (act))):
print(act['act_name'][0])
os.makedirs(out_dir + '/' + act['act_name'][0])
prepareOneActivity(act, out_dir + "/" + act['act_name'][0])
html_str += "<tr><td>" + str(act['act_name'][0]) + "</td>"
html_str += '<td><image src="' +  './' + act['act_name'][0] + '/1.png' + '"/></td>'
html_str += '<td><image src="' +  './' + act['act_name'][0] + '/2.png' + '"/></td>'
html_str += '<td><image src="' +  './' + act['act_name'][0] + '/3.png' + '"/></td>'
html_str += """
</indent>
</table>
"""
Html_file = open(out_dir + '/' + "report.html", "w")
Html_file.write(html_str)
Html_file.close()
webbrowser.open(out_dir + '/' + "report.html")
Data Extraction
The MyHandler2 gets the callback from Strava OAuth process and parses the access code from the URL parameters. With the code, the script logs into the Strava API (line 301) and gets the Athlete (= user) data. I was interested in the Activities, so the script retrieves a list of them (line 285). In the final step, the detailed data for each activity is requested. There are 11 types of data available, e.g. ‘time’, ‘latlng’, ‘heartrate’, etc. To analyze Strava training activities, I need ‘time’, ‘heartrate’, ‘velocity_smooth’ and ‘cadence’. After retrieving and parsing the data, the script hands it over to the main scope (line 315). Of course, this could be done better.
#!/usr/bin/python
# -*- coding: utf-8 -*-
import stravalib
import http.server
import urllib.parse
import webbrowser
import pandas as pd
import matplotlib.pyplot as plt
import numpy as np
import os
from mpl_toolkits.axes_grid1 import host_subplot
import mpl_toolkits.axisartist as AA
# -----------------------------------------------------------------------------
# *** Setup Section ***
# -----------------------------------------------------------------------------
# Port of the webserver
port = 5000
# Output Directory
out_dir = './out/'
# Initialize helper Vars
# limiter of the number of activities requested
limit = 25
# Create redirect URL
url = 'http://localhost:%d/authorized' % port
# List of available types:
# https://pythonhosted.org/stravalib/api.html?highlight=get_activity_streams#stravalib.client.Client.get_activity_streams
types = ['time', 'heartrate', 'velocity_smooth', 'cadence']
# -----------------------------------------------------------------------------
# Functions and Classes
# -----------------------------------------------------------------------------
# Define the web functions to call from the strava API
def UseCode(code):
# Retrieve the login code from the Strava server
access_token = client.exchange_code_for_token(client_id=client_id,
client_secret=secret,
code=code)
# Now store that access token somewhere (for now, it's just a local
# variable)
client.access_token = access_token
athlete = client.get_athlete()
print("For %(id)s, I now have an access token %(token)s" %
{'id': athlete.id, 'token': access_token})
return client
def GetActivities(client, limit):
# Returns a list of Strava activity objects, up to the number specified
# by limit
activities = client.get_activities(limit=limit)
assert len(list(activities)) == limit
return activities
def GetStreams(client, activity, types):
# Returns a Strava 'stream', which is timeseries data from an activity
streams = client.get_activity_streams(activity,
types=types, series_type='time')
return streams
def DataFrame(dict, types):
# Converts a Stream into a dataframe, and returns the dataframe
# print(dict, types)
df = pd.DataFrame()
for item in types:
if item in dict.keys():
df.append(item.data)
df.fillna('', inplace=True)
return df
def ParseActivity(act, types):
act_id = act.id
name = act.name
# print(str(act_id), str(act.name), act.start_date)
streams = GetStreams(client, act_id, types)
df = pd.DataFrame()
# Write each row to a dataframe
for item in types:
if item in streams.keys():
df[item] = pd.Series(streams[item].data, index=None)
df['act_id'] = act.id
df['act_startDate'] = pd.to_datetime(act.start_date)
df['act_name'] = name
return df
def convMs2Kmh(speed):
# Convert m/s in km/h
return speed / 1000 / (1 / 3600)
def prepareOneActivity(my_data, dir):
# Prepare the heartrate data for barplot
counts = [0, 0, 0, 0, 0]
data = my_data['heartrate']
for point in data:
if (point < 137):
counts[0] += 1
elif (point >= 137 and point < 151):
counts[1] += 1
elif (point >= 151 and point < 165):
counts[2] += 1
elif (point >= 165 and point < 172):
counts[3] += 1
elif (point > 179):
counts[4] += 1
tmp = counts
total = sum(tmp)
counts = [(1. * x / total) * 100 for x in tmp]
# Prepare the various data for boxplots
hfrq_by_zones = [[], [], [], [], []]
cadz_by_zones = [[], [], [], [], []]
velo_by_zones = [[], [], [], [], []]
my_list = list()
my_list.append(list(my_data['heartrate']))
my_list.append(list(my_data['velocity_smooth']))
if ('cadence' in my_data):
my_list.append(list(my_data['cadence']))
else:
my_list.append([0] * my_data['velocity_smooth'])
my_array = zip(*my_list)
for hr, vs, cd in my_array:
vs = convMs2Kmh(vs)
if (hr < 137):
hfrq_by_zones[0].append(hr)
cadz_by_zones[0].append(cd)
velo_by_zones[0].append(vs)
elif (hr >= 137 and hr < 151):
hfrq_by_zones[1].append(hr)
cadz_by_zones[1].append(cd)
velo_by_zones[1].append(vs)
elif (hr >= 151 and hr < 165):
hfrq_by_zones[2].append(hr)
cadz_by_zones[2].append(cd)
velo_by_zones[2].append(vs)
elif (hr >= 165 and hr < 172):
hfrq_by_zones[3].append(hr)
cadz_by_zones[3].append(cd)
velo_by_zones[3].append(vs)
elif (hr > 179):
hfrq_by_zones[4].append(hr)
cadz_by_zones[4].append(cd)
velo_by_zones[4].append(vs)
# -----------------------------------------------------------------------------
# Prepare bar plot of number of values in the zone
# -----------------------------------------------------------------------------
objects = ('S', 'GA1', 'GA2', 'EB', 'SB')
y_pos = np.arange(len(objects))
plt.figure()
plt.bar(y_pos, counts, align='center', alpha=0.5)
plt.xticks(y_pos, objects)
plt.ylabel('Percentage of activity')
plt.xlabel('Zones')
plt.title('Heartrate Zones')
plt.ylim([0, 100])
plt.savefig(dir + '/' + '1.png')
# -----------------------------------------------------------------------------
# Prepare the bar plot combined with boxplot of velocity & cadence
# -----------------------------------------------------------------------------
data_len = [int(i) for i in counts]
plt.figure()
host = host_subplot(111, axes_class=AA.Axes)
plt.subplots_adjust(right=0.75)
ax2 = host.twinx()
ax3 = host.twinx()
offset = 60
new_fixed_axis = ax3.get_grid_helper().new_fixed_axis
ax3.axis["right"] = new_fixed_axis(loc="right", axes=ax3,
offset=(offset, 0))
ax2.axis["right"].toggle(all=True)
ax2_min = -100
ax2_max = 175
ax3_min = 0
ax3_max = 100
host.set_ylim([0, 100])
ax2.set_ylim([ax2_min, ax2_max])
ax3.set_ylim([ax3_min, ax3_max])
host.set_xlabel("Zones")
host.set_ylabel("Percentage of activity")
ax2.set_ylabel("Cadence")
ax3.set_ylabel("Velocity")
host.bar(range(1, len(data_len) + 1), data_len, align='center',
color="lightgrey")
bp1 = ax2.boxplot(cadz_by_zones, widths=0.6)
bp2 = ax3.boxplot(velo_by_zones, widths=0.6)
ax2.axis["right"].label.set_color("red")
ax3.axis["right"].label.set_color("blue")
host.set_xticklabels(objects, rotation='vertical')
# major ticks every 20, minor ticks every 5
ax2_major_ticks = np.arange(ax2_min, ax2_max, 20)
ax2_minor_ticks = np.arange(ax2_min, ax2_max, 5)
ax2.set_yticks(ax2_major_ticks)
ax2.set_yticks(ax2_minor_ticks, minor=True)
ax3_major_ticks = np.arange(ax3_min, ax3_max, 20)
ax3_minor_ticks = np.arange(ax3_min, ax3_max, 5)
ax3.set_yticks(ax3_major_ticks)
ax3.set_yticks(ax3_minor_ticks, minor=True)
for box in bp1['boxes']:
box.set(color='red', linewidth=1)
for box in bp2['boxes']:
box.set(color='blue', linewidth=1)
plt.savefig(dir + '/' + '2.png')
# -----------------------------------------------------------------------------
# Setup
# -----------------------------------------------------------------------------
plt.figure()
fig, axes = plt.subplots(nrows=1, ncols=2, figsize=(9, 4))
bplot1 = axes[0].boxplot(hfrq_by_zones, vert=True, patch_artist=True)
bplot2 = axes[1].boxplot(data, vert=True, patch_artist=True)
colors = ['pink', 'lightblue', 'lightgreen']
for bplot in (bplot1, bplot2):
for patch, color in zip(bplot['boxes'], colors):
patch.set_facecolor(color)
axes[0].yaxis.grid(True)
axes[1].yaxis.grid(True)
axes[0].set_xticks([y + 1 for y in range(len(hfrq_by_zones))], )
axes[0].set_xlabel('Zones')
axes[0].set_ylabel('Heartrate')
axes[0].set_ylim([100, 230])
axes[1].set_ylim([100, 230])
plt.setp(axes[0], xticks=[y + 1 for y in range(len(hfrq_by_zones))],
xticklabels=objects)
plt.setp(axes[1], xticks=[1],
xticklabels=["All"])
# -----------------------------------------------------------------------------
# Display the plot windows
# -----------------------------------------------------------------------------
plt.savefig(dir + '/' + '3.png')
class MyHandler2(http.server.BaseHTTPRequestHandler):
# Handle the web data sent from the strava API
allDone = False
data = {}
def do_HEAD(self):
return self.do_GET()
def do_GET(self):
# Get the API code for Strava
# self.wfile.write('<script>window.close();</script>')
code = urllib.parse.parse_qs(
urllib.parse.urlparse(self.path).query)['code'][0]
# Login to the API
client = UseCode(code)
# Retrieve the last limit activities
activities = GetActivities(client, limit)
for item in activities:
print(item.name)
# Loop through the activities, and create a dict of the dataframe
# stream data of each activity
print("looping through activities...")
df_lst = {}
for act in activities:
df_lst[act.start_date] = ParseActivity(act, types)
MyHandler2.data = df_lst
MyHandler2.allDone = True
# -----------------------------------------------------------------------------
# *** Run Section ***
# -----------------------------------------------------------------------------
# -----------------------------------------------------------------------------
# Request access via local browser
# -----------------------------------------------------------------------------
client_id, secret = open('client.secret').read().strip().split(',')
# Create the strava client, and open the web browser for authentication
client = stravalib.client.Client()
authorize_url = client.authorization_url(client_id=client_id, redirect_uri=url)
print('Opening: %s' % authorize_url)
webbrowser.open(authorize_url)
# -----------------------------------------------------------------------------
# Start webserver and wait for redirect local browser
# -----------------------------------------------------------------------------
httpd = http.server.HTTPServer(('localhost', port), MyHandler2)
while not MyHandler2.allDone:
print(MyHandler2.allDone)
httpd.handle_request()
# -----------------------------------------------------------------------------
# Data preparation
# -----------------------------------------------------------------------------
# if os.path.exists(out_dir):
#    os.remove(out_dir)
os.makedirs(out_dir)
html_str = """
<table border=1>
<tr>
<th>Name</th>
<th>1</th>
<th>2</th>
<th>3</th>
</tr>
<indent>
"""
name_counter = {}
for act in iter(MyHandler2.data.values()):
if (len(act['act_name']) > 0 and ('heartrate' in (act))):
if act['act_name'][0] in name_counter:
name_counter[act['act_name'][0]] += 1
act['act_name'][0] = act['act_name'][0] + str(name_counter[
act['act_name'][0]])
else:
name_counter[act['act_name'][0]] = 0
for act in iter(MyHandler2.data.values()):
if (len(act['act_name']) > 0 and ('heartrate' in (act))):
print(act['act_name'][0])
os.makedirs(out_dir + '/' + act['act_name'][0])
prepareOneActivity(act, out_dir + "/" + act['act_name'][0])
html_str += "<tr><td>" + str(act['act_name'][0]) + "</td>"
html_str += '<td><image src="' +  './' + act['act_name'][0] + '/1.png' + '"/></td>'
html_str += '<td><image src="' +  './' + act['act_name'][0] + '/2.png' + '"/></td>'
html_str += '<td><image src="' +  './' + act['act_name'][0] + '/3.png' + '"/></td>'
html_str += """
</indent>
</table>
"""
Html_file = open(out_dir + '/' + "report.html", "w")
Html_file.write(html_str)
Html_file.close()
webbrowser.open(out_dir + '/' + "report.html")
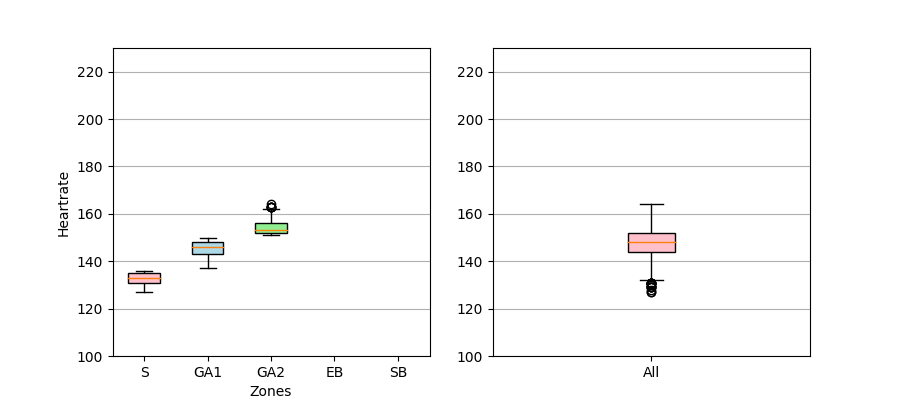
Data Visualization
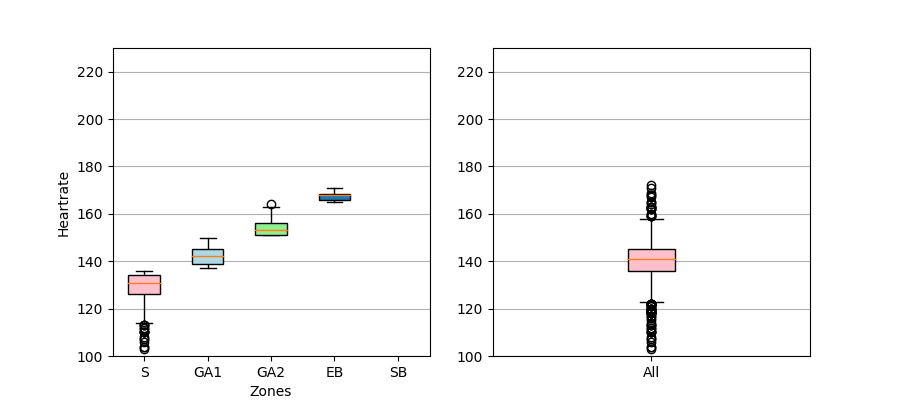
Now, we come to the most interesting part, the data visualization. What I can’t see in the Strava stats, on Veloviewer nor on Garmin Connect is the distribution work in the heart rate zones. This way I can check how effectively I trained. Additionally, I wanted to see some details of the population of velocity and cadence in the heart rate in the zones. This is just explorative, I wanted to find out if there are any patterns visible. The third graph is a boxplot of the heart rate values grouped by the zones.
I used plain simple matplotlib to generate the graphs. Matplotlib needs the data prepared in data structures. Of course, the data structure from Strava is not compatible, so data preparation is needed. The script iterates over the activities (line 373-381) and calls function prepareOneActivity for each (ignore the html for the moment).
#!/usr/bin/python
# -*- coding: utf-8 -*-
import stravalib
import http.server
import urllib.parse
import webbrowser
import pandas as pd
import matplotlib.pyplot as plt
import numpy as np
import os
from mpl_toolkits.axes_grid1 import host_subplot
import mpl_toolkits.axisartist as AA
# -----------------------------------------------------------------------------
# *** Setup Section ***
# -----------------------------------------------------------------------------
# Port of the webserver
port = 5000
# Output Directory
out_dir = './out/'
# Initialize helper Vars
# limiter of the number of activities requested
limit = 25
# Create redirect URL
url = 'http://localhost:%d/authorized' % port
# List of available types:
# https://pythonhosted.org/stravalib/api.html?highlight=get_activity_streams#stravalib.client.Client.get_activity_streams
types = ['time', 'heartrate', 'velocity_smooth', 'cadence']
# -----------------------------------------------------------------------------
# Functions and Classes
# -----------------------------------------------------------------------------
# Define the web functions to call from the strava API
def UseCode(code):
# Retrieve the login code from the Strava server
access_token = client.exchange_code_for_token(client_id=client_id,
client_secret=secret,
code=code)
# Now store that access token somewhere (for now, it's just a local
# variable)
client.access_token = access_token
athlete = client.get_athlete()
print("For %(id)s, I now have an access token %(token)s" %
{'id': athlete.id, 'token': access_token})
return client
def GetActivities(client, limit):
# Returns a list of Strava activity objects, up to the number specified
# by limit
activities = client.get_activities(limit=limit)
assert len(list(activities)) == limit
return activities
def GetStreams(client, activity, types):
# Returns a Strava 'stream', which is timeseries data from an activity
streams = client.get_activity_streams(activity,
types=types, series_type='time')
return streams
def DataFrame(dict, types):
# Converts a Stream into a dataframe, and returns the dataframe
# print(dict, types)
df = pd.DataFrame()
for item in types:
if item in dict.keys():
df.append(item.data)
df.fillna('', inplace=True)
return df
def ParseActivity(act, types):
act_id = act.id
name = act.name
# print(str(act_id), str(act.name), act.start_date)
streams = GetStreams(client, act_id, types)
df = pd.DataFrame()
# Write each row to a dataframe
for item in types:
if item in streams.keys():
df[item] = pd.Series(streams[item].data, index=None)
df['act_id'] = act.id
df['act_startDate'] = pd.to_datetime(act.start_date)
df['act_name'] = name
return df
def convMs2Kmh(speed):
# Convert m/s in km/h
return speed / 1000 / (1 / 3600)
def prepareOneActivity(my_data, dir):
# Prepare the heartrate data for barplot
counts = [0, 0, 0, 0, 0]
data = my_data['heartrate']
for point in data:
if (point < 137):
counts[0] += 1
elif (point >= 137 and point < 151):
counts[1] += 1
elif (point >= 151 and point < 165):
counts[2] += 1
elif (point >= 165 and point < 172):
counts[3] += 1
elif (point > 179):
counts[4] += 1
tmp = counts
total = sum(tmp)
counts = [(1. * x / total) * 100 for x in tmp]
# Prepare the various data for boxplots
hfrq_by_zones = [[], [], [], [], []]
cadz_by_zones = [[], [], [], [], []]
velo_by_zones = [[], [], [], [], []]
my_list = list()
my_list.append(list(my_data['heartrate']))
my_list.append(list(my_data['velocity_smooth']))
if ('cadence' in my_data):
my_list.append(list(my_data['cadence']))
else:
my_list.append([0] * my_data['velocity_smooth'])
my_array = zip(*my_list)
for hr, vs, cd in my_array:
vs = convMs2Kmh(vs)
if (hr < 137):
hfrq_by_zones[0].append(hr)
cadz_by_zones[0].append(cd)
velo_by_zones[0].append(vs)
elif (hr >= 137 and hr < 151):
hfrq_by_zones[1].append(hr)
cadz_by_zones[1].append(cd)
velo_by_zones[1].append(vs)
elif (hr >= 151 and hr < 165):
hfrq_by_zones[2].append(hr)
cadz_by_zones[2].append(cd)
velo_by_zones[2].append(vs)
elif (hr >= 165 and hr < 172):
hfrq_by_zones[3].append(hr)
cadz_by_zones[3].append(cd)
velo_by_zones[3].append(vs)
elif (hr > 179):
hfrq_by_zones[4].append(hr)
cadz_by_zones[4].append(cd)
velo_by_zones[4].append(vs)
# -----------------------------------------------------------------------------
# Prepare bar plot of number of values in the zone
# -----------------------------------------------------------------------------
objects = ('S', 'GA1', 'GA2', 'EB', 'SB')
y_pos = np.arange(len(objects))
plt.figure()
plt.bar(y_pos, counts, align='center', alpha=0.5)
plt.xticks(y_pos, objects)
plt.ylabel('Percentage of activity')
plt.xlabel('Zones')
plt.title('Heartrate Zones')
plt.ylim([0, 100])
plt.savefig(dir + '/' + '1.png')
# -----------------------------------------------------------------------------
# Prepare the bar plot combined with boxplot of velocity & cadence
# -----------------------------------------------------------------------------
data_len = [int(i) for i in counts]
plt.figure()
host = host_subplot(111, axes_class=AA.Axes)
plt.subplots_adjust(right=0.75)
ax2 = host.twinx()
ax3 = host.twinx()
offset = 60
new_fixed_axis = ax3.get_grid_helper().new_fixed_axis
ax3.axis["right"] = new_fixed_axis(loc="right", axes=ax3,
offset=(offset, 0))
ax2.axis["right"].toggle(all=True)
ax2_min = -100
ax2_max = 175
ax3_min = 0
ax3_max = 100
host.set_ylim([0, 100])
ax2.set_ylim([ax2_min, ax2_max])
ax3.set_ylim([ax3_min, ax3_max])
host.set_xlabel("Zones")
host.set_ylabel("Percentage of activity")
ax2.set_ylabel("Cadence")
ax3.set_ylabel("Velocity")
host.bar(range(1, len(data_len) + 1), data_len, align='center',
color="lightgrey")
bp1 = ax2.boxplot(cadz_by_zones, widths=0.6)
bp2 = ax3.boxplot(velo_by_zones, widths=0.6)
ax2.axis["right"].label.set_color("red")
ax3.axis["right"].label.set_color("blue")
host.set_xticklabels(objects, rotation='vertical')
# major ticks every 20, minor ticks every 5
ax2_major_ticks = np.arange(ax2_min, ax2_max, 20)
ax2_minor_ticks = np.arange(ax2_min, ax2_max, 5)
ax2.set_yticks(ax2_major_ticks)
ax2.set_yticks(ax2_minor_ticks, minor=True)
ax3_major_ticks = np.arange(ax3_min, ax3_max, 20)
ax3_minor_ticks = np.arange(ax3_min, ax3_max, 5)
ax3.set_yticks(ax3_major_ticks)
ax3.set_yticks(ax3_minor_ticks, minor=True)
for box in bp1['boxes']:
box.set(color='red', linewidth=1)
for box in bp2['boxes']:
box.set(color='blue', linewidth=1)
plt.savefig(dir + '/' + '2.png')
# -----------------------------------------------------------------------------
# Setup
# -----------------------------------------------------------------------------
plt.figure()
fig, axes = plt.subplots(nrows=1, ncols=2, figsize=(9, 4))
bplot1 = axes[0].boxplot(hfrq_by_zones, vert=True, patch_artist=True)
bplot2 = axes[1].boxplot(data, vert=True, patch_artist=True)
colors = ['pink', 'lightblue', 'lightgreen']
for bplot in (bplot1, bplot2):
for patch, color in zip(bplot['boxes'], colors):
patch.set_facecolor(color)
axes[0].yaxis.grid(True)
axes[1].yaxis.grid(True)
axes[0].set_xticks([y + 1 for y in range(len(hfrq_by_zones))], )
axes[0].set_xlabel('Zones')
axes[0].set_ylabel('Heartrate')
axes[0].set_ylim([100, 230])
axes[1].set_ylim([100, 230])
plt.setp(axes[0], xticks=[y + 1 for y in range(len(hfrq_by_zones))],
xticklabels=objects)
plt.setp(axes[1], xticks=[1],
xticklabels=["All"])
# -----------------------------------------------------------------------------
# Display the plot windows
# -----------------------------------------------------------------------------
plt.savefig(dir + '/' + '3.png')
class MyHandler2(http.server.BaseHTTPRequestHandler):
# Handle the web data sent from the strava API
allDone = False
data = {}
def do_HEAD(self):
return self.do_GET()
def do_GET(self):
# Get the API code for Strava
# self.wfile.write('<script>window.close();</script>')
code = urllib.parse.parse_qs(
urllib.parse.urlparse(self.path).query)['code'][0]
# Login to the API
client = UseCode(code)
# Retrieve the last limit activities
activities = GetActivities(client, limit)
for item in activities:
print(item.name)
# Loop through the activities, and create a dict of the dataframe
# stream data of each activity
print("looping through activities...")
df_lst = {}
for act in activities:
df_lst[act.start_date] = ParseActivity(act, types)
MyHandler2.data = df_lst
MyHandler2.allDone = True
# -----------------------------------------------------------------------------
# *** Run Section ***
# -----------------------------------------------------------------------------
# -----------------------------------------------------------------------------
# Request access via local browser
# -----------------------------------------------------------------------------
client_id, secret = open('client.secret').read().strip().split(',')
# Create the strava client, and open the web browser for authentication
client = stravalib.client.Client()
authorize_url = client.authorization_url(client_id=client_id, redirect_uri=url)
print('Opening: %s' % authorize_url)
webbrowser.open(authorize_url)
# -----------------------------------------------------------------------------
# Start webserver and wait for redirect local browser
# -----------------------------------------------------------------------------
httpd = http.server.HTTPServer(('localhost', port), MyHandler2)
while not MyHandler2.allDone:
print(MyHandler2.allDone)
httpd.handle_request()
# -----------------------------------------------------------------------------
# Data preparation
# -----------------------------------------------------------------------------
# if os.path.exists(out_dir):
#    os.remove(out_dir)
os.makedirs(out_dir)
html_str = """
<table border=1>
<tr>
<th>Name</th>
<th>1</th>
<th>2</th>
<th>3</th>
</tr>
<indent>
"""
name_counter = {}
for act in iter(MyHandler2.data.values()):
if (len(act['act_name']) > 0 and ('heartrate' in (act))):
if act['act_name'][0] in name_counter:
name_counter[act['act_name'][0]] += 1
act['act_name'][0] = act['act_name'][0] + str(name_counter[
act['act_name'][0]])
else:
name_counter[act['act_name'][0]] = 0
for act in iter(MyHandler2.data.values()):
if (len(act['act_name']) > 0 and ('heartrate' in (act))):
print(act['act_name'][0])
os.makedirs(out_dir + '/' + act['act_name'][0])
prepareOneActivity(act, out_dir + "/" + act['act_name'][0])
html_str += "<tr><td>" + str(act['act_name'][0]) + "</td>"
html_str += '<td><image src="' +  './' + act['act_name'][0] + '/1.png' + '"/></td>'
html_str += '<td><image src="' +  './' + act['act_name'][0] + '/2.png' + '"/></td>'
html_str += '<td><image src="' +  './' + act['act_name'][0] + '/3.png' + '"/></td>'
html_str += """
</indent>
</table>
"""
Html_file = open(out_dir + '/' + "report.html", "w")
Html_file.write(html_str)
Html_file.close()
webbrowser.open(out_dir + '/' + "report.html")
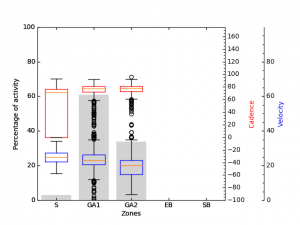
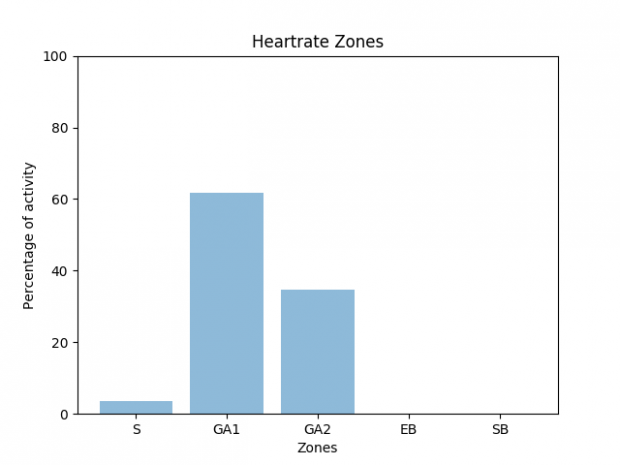
At first, the heart rate is grouped by zones: recovery, basic endurance 1. basic endurance 2, development area, peak area. After that, the values of velocity and cadence is grouped by heart rate zones. After the data structures are prepared, the plots are created (line 109-165). The first diagram is a simple bar plot. Besides the plot itself, it just needs some labeling and it is done (line 170-183). The second diagram is a little bit more tricky, I wanted to have box plots of velocity and cadence over the bars of the heart rates. Have a look on the header image, this is an example plot. To make it readable in the end, it needs to customize the axes of the box plots. In that way, it is necessary to create a host plot (host_subplot) and two subplots (twinx). So there are three y-scales, but just two sides in the diagram. The y-scale of the second subplot ax3 needs some offset to be readable. Both axis of the box plots ax2 and ax3 should be on the right. To prevent overlay of the two box plots, scale limits are tweaked in line 208-210. In the lines 218-243 the readability is improved, with y-ticks and colors.
#!/usr/bin/python
# -*- coding: utf-8 -*-
import stravalib
import http.server
import urllib.parse
import webbrowser
import pandas as pd
import matplotlib.pyplot as plt
import numpy as np
import os
from mpl_toolkits.axes_grid1 import host_subplot
import mpl_toolkits.axisartist as AA
# -----------------------------------------------------------------------------
# *** Setup Section ***
# -----------------------------------------------------------------------------
# Port of the webserver
port = 5000
# Output Directory
out_dir = './out/'
# Initialize helper Vars
# limiter of the number of activities requested
limit = 25
# Create redirect URL
url = 'http://localhost:%d/authorized' % port
# List of available types:
# https://pythonhosted.org/stravalib/api.html?highlight=get_activity_streams#stravalib.client.Client.get_activity_streams
types = ['time', 'heartrate', 'velocity_smooth', 'cadence']
# -----------------------------------------------------------------------------
# Functions and Classes
# -----------------------------------------------------------------------------
# Define the web functions to call from the strava API
def UseCode(code):
# Retrieve the login code from the Strava server
access_token = client.exchange_code_for_token(client_id=client_id,
client_secret=secret,
code=code)
# Now store that access token somewhere (for now, it's just a local
# variable)
client.access_token = access_token
athlete = client.get_athlete()
print("For %(id)s, I now have an access token %(token)s" %
{'id': athlete.id, 'token': access_token})
return client
def GetActivities(client, limit):
# Returns a list of Strava activity objects, up to the number specified
# by limit
activities = client.get_activities(limit=limit)
assert len(list(activities)) == limit
return activities
def GetStreams(client, activity, types):
# Returns a Strava 'stream', which is timeseries data from an activity
streams = client.get_activity_streams(activity,
types=types, series_type='time')
return streams
def DataFrame(dict, types):
# Converts a Stream into a dataframe, and returns the dataframe
# print(dict, types)
df = pd.DataFrame()
for item in types:
if item in dict.keys():
df.append(item.data)
df.fillna('', inplace=True)
return df
def ParseActivity(act, types):
act_id = act.id
name = act.name
# print(str(act_id), str(act.name), act.start_date)
streams = GetStreams(client, act_id, types)
df = pd.DataFrame()
# Write each row to a dataframe
for item in types:
if item in streams.keys():
df[item] = pd.Series(streams[item].data, index=None)
df['act_id'] = act.id
df['act_startDate'] = pd.to_datetime(act.start_date)
df['act_name'] = name
return df
def convMs2Kmh(speed):
# Convert m/s in km/h
return speed / 1000 / (1 / 3600)
def prepareOneActivity(my_data, dir):
# Prepare the heartrate data for barplot
counts = [0, 0, 0, 0, 0]
data = my_data['heartrate']
for point in data:
if (point < 137):
counts[0] += 1
elif (point >= 137 and point < 151):
counts[1] += 1
elif (point >= 151 and point < 165):
counts[2] += 1
elif (point >= 165 and point < 172):
counts[3] += 1
elif (point > 179):
counts[4] += 1
tmp = counts
total = sum(tmp)
counts = [(1. * x / total) * 100 for x in tmp]
# Prepare the various data for boxplots
hfrq_by_zones = [[], [], [], [], []]
cadz_by_zones = [[], [], [], [], []]
velo_by_zones = [[], [], [], [], []]
my_list = list()
my_list.append(list(my_data['heartrate']))
my_list.append(list(my_data['velocity_smooth']))
if ('cadence' in my_data):
my_list.append(list(my_data['cadence']))
else:
my_list.append([0] * my_data['velocity_smooth'])
my_array = zip(*my_list)
for hr, vs, cd in my_array:
vs = convMs2Kmh(vs)
if (hr < 137):
hfrq_by_zones[0].append(hr)
cadz_by_zones[0].append(cd)
velo_by_zones[0].append(vs)
elif (hr >= 137 and hr < 151):
hfrq_by_zones[1].append(hr)
cadz_by_zones[1].append(cd)
velo_by_zones[1].append(vs)
elif (hr >= 151 and hr < 165):
hfrq_by_zones[2].append(hr)
cadz_by_zones[2].append(cd)
velo_by_zones[2].append(vs)
elif (hr >= 165 and hr < 172):
hfrq_by_zones[3].append(hr)
cadz_by_zones[3].append(cd)
velo_by_zones[3].append(vs)
elif (hr > 179):
hfrq_by_zones[4].append(hr)
cadz_by_zones[4].append(cd)
velo_by_zones[4].append(vs)
# -----------------------------------------------------------------------------
# Prepare bar plot of number of values in the zone
# -----------------------------------------------------------------------------
objects = ('S', 'GA1', 'GA2', 'EB', 'SB')
y_pos = np.arange(len(objects))
plt.figure()
plt.bar(y_pos, counts, align='center', alpha=0.5)
plt.xticks(y_pos, objects)
plt.ylabel('Percentage of activity')
plt.xlabel('Zones')
plt.title('Heartrate Zones')
plt.ylim([0, 100])
plt.savefig(dir + '/' + '1.png')
# -----------------------------------------------------------------------------
# Prepare the bar plot combined with boxplot of velocity & cadence
# -----------------------------------------------------------------------------
data_len = [int(i) for i in counts]
plt.figure()
host = host_subplot(111, axes_class=AA.Axes)
plt.subplots_adjust(right=0.75)
ax2 = host.twinx()
ax3 = host.twinx()
offset = 60
new_fixed_axis = ax3.get_grid_helper().new_fixed_axis
ax3.axis["right"] = new_fixed_axis(loc="right", axes=ax3,
offset=(offset, 0))
ax2.axis["right"].toggle(all=True)
ax2_min = -100
ax2_max = 175
ax3_min = 0
ax3_max = 100
host.set_ylim([0, 100])
ax2.set_ylim([ax2_min, ax2_max])
ax3.set_ylim([ax3_min, ax3_max])
host.set_xlabel("Zones")
host.set_ylabel("Percentage of activity")
ax2.set_ylabel("Cadence")
ax3.set_ylabel("Velocity")
host.bar(range(1, len(data_len) + 1), data_len, align='center',
color="lightgrey")
bp1 = ax2.boxplot(cadz_by_zones, widths=0.6)
bp2 = ax3.boxplot(velo_by_zones, widths=0.6)
ax2.axis["right"].label.set_color("red")
ax3.axis["right"].label.set_color("blue")
host.set_xticklabels(objects, rotation='vertical')
# major ticks every 20, minor ticks every 5
ax2_major_ticks = np.arange(ax2_min, ax2_max, 20)
ax2_minor_ticks = np.arange(ax2_min, ax2_max, 5)
ax2.set_yticks(ax2_major_ticks)
ax2.set_yticks(ax2_minor_ticks, minor=True)
ax3_major_ticks = np.arange(ax3_min, ax3_max, 20)
ax3_minor_ticks = np.arange(ax3_min, ax3_max, 5)
ax3.set_yticks(ax3_major_ticks)
ax3.set_yticks(ax3_minor_ticks, minor=True)
for box in bp1['boxes']:
box.set(color='red', linewidth=1)
for box in bp2['boxes']:
box.set(color='blue', linewidth=1)
plt.savefig(dir + '/' + '2.png')
# -----------------------------------------------------------------------------
# Setup
# -----------------------------------------------------------------------------
plt.figure()
fig, axes = plt.subplots(nrows=1, ncols=2, figsize=(9, 4))
bplot1 = axes[0].boxplot(hfrq_by_zones, vert=True, patch_artist=True)
bplot2 = axes[1].boxplot(data, vert=True, patch_artist=True)
colors = ['pink', 'lightblue', 'lightgreen']
for bplot in (bplot1, bplot2):
for patch, color in zip(bplot['boxes'], colors):
patch.set_facecolor(color)
axes[0].yaxis.grid(True)
axes[1].yaxis.grid(True)
axes[0].set_xticks([y + 1 for y in range(len(hfrq_by_zones))], )
axes[0].set_xlabel('Zones')
axes[0].set_ylabel('Heartrate')
axes[0].set_ylim([100, 230])
axes[1].set_ylim([100, 230])
plt.setp(axes[0], xticks=[y + 1 for y in range(len(hfrq_by_zones))],
xticklabels=objects)
plt.setp(axes[1], xticks=[1],
xticklabels=["All"])
# -----------------------------------------------------------------------------
# Display the plot windows
# -----------------------------------------------------------------------------
plt.savefig(dir + '/' + '3.png')
class MyHandler2(http.server.BaseHTTPRequestHandler):
# Handle the web data sent from the strava API
allDone = False
data = {}
def do_HEAD(self):
return self.do_GET()
def do_GET(self):
# Get the API code for Strava
# self.wfile.write('<script>window.close();</script>')
code = urllib.parse.parse_qs(
urllib.parse.urlparse(self.path).query)['code'][0]
# Login to the API
client = UseCode(code)
# Retrieve the last limit activities
activities = GetActivities(client, limit)
for item in activities:
print(item.name)
# Loop through the activities, and create a dict of the dataframe
# stream data of each activity
print("looping through activities...")
df_lst = {}
for act in activities:
df_lst[act.start_date] = ParseActivity(act, types)
MyHandler2.data = df_lst
MyHandler2.allDone = True
# -----------------------------------------------------------------------------
# *** Run Section ***
# -----------------------------------------------------------------------------
# -----------------------------------------------------------------------------
# Request access via local browser
# -----------------------------------------------------------------------------
client_id, secret = open('client.secret').read().strip().split(',')
# Create the strava client, and open the web browser for authentication
client = stravalib.client.Client()
authorize_url = client.authorization_url(client_id=client_id, redirect_uri=url)
print('Opening: %s' % authorize_url)
webbrowser.open(authorize_url)
# -----------------------------------------------------------------------------
# Start webserver and wait for redirect local browser
# -----------------------------------------------------------------------------
httpd = http.server.HTTPServer(('localhost', port), MyHandler2)
while not MyHandler2.allDone:
print(MyHandler2.allDone)
httpd.handle_request()
# -----------------------------------------------------------------------------
# Data preparation
# -----------------------------------------------------------------------------
# if os.path.exists(out_dir):
#    os.remove(out_dir)
os.makedirs(out_dir)
html_str = """
<table border=1>
<tr>
<th>Name</th>
<th>1</th>
<th>2</th>
<th>3</th>
</tr>
<indent>
"""
name_counter = {}
for act in iter(MyHandler2.data.values()):
if (len(act['act_name']) > 0 and ('heartrate' in (act))):
if act['act_name'][0] in name_counter:
name_counter[act['act_name'][0]] += 1
act['act_name'][0] = act['act_name'][0] + str(name_counter[
act['act_name'][0]])
else:
name_counter[act['act_name'][0]] = 0
for act in iter(MyHandler2.data.values()):
if (len(act['act_name']) > 0 and ('heartrate' in (act))):
print(act['act_name'][0])
os.makedirs(out_dir + '/' + act['act_name'][0])
prepareOneActivity(act, out_dir + "/" + act['act_name'][0])
html_str += "<tr><td>" + str(act['act_name'][0]) + "</td>"
html_str += '<td><image src="' +  './' + act['act_name'][0] + '/1.png' + '"/></td>'
html_str += '<td><image src="' +  './' + act['act_name'][0] + '/2.png' + '"/></td>'
html_str += '<td><image src="' +  './' + act['act_name'][0] + '/3.png' + '"/></td>'
html_str += """
</indent>
</table>
"""
Html_file = open(out_dir + '/' + "report.html", "w")
Html_file.write(html_str)
Html_file.close()
webbrowser.open(out_dir + '/' + "report.html")
Finally, it can be plotted. All the diagrams were plotted into files. To compare them on screen, the script creates a simple website with tables [1999 sic!] of diagrams.
#!/usr/bin/python
# -*- coding: utf-8 -*-
import stravalib
import http.server
import urllib.parse
import webbrowser
import pandas as pd
import matplotlib.pyplot as plt
import numpy as np
import os
from mpl_toolkits.axes_grid1 import host_subplot
import mpl_toolkits.axisartist as AA
# -----------------------------------------------------------------------------
# *** Setup Section ***
# -----------------------------------------------------------------------------
# Port of the webserver
port = 5000
# Output Directory
out_dir = './out/'
# Initialize helper Vars
# limiter of the number of activities requested
limit = 25
# Create redirect URL
url = 'http://localhost:%d/authorized' % port
# List of available types:
# https://pythonhosted.org/stravalib/api.html?highlight=get_activity_streams#stravalib.client.Client.get_activity_streams
types = ['time', 'heartrate', 'velocity_smooth', 'cadence']
# -----------------------------------------------------------------------------
# Functions and Classes
# -----------------------------------------------------------------------------
# Define the web functions to call from the strava API
def UseCode(code):
# Retrieve the login code from the Strava server
access_token = client.exchange_code_for_token(client_id=client_id,
client_secret=secret,
code=code)
# Now store that access token somewhere (for now, it's just a local
# variable)
client.access_token = access_token
athlete = client.get_athlete()
print("For %(id)s, I now have an access token %(token)s" %
{'id': athlete.id, 'token': access_token})
return client
def GetActivities(client, limit):
# Returns a list of Strava activity objects, up to the number specified
# by limit
activities = client.get_activities(limit=limit)
assert len(list(activities)) == limit
return activities
def GetStreams(client, activity, types):
# Returns a Strava 'stream', which is timeseries data from an activity
streams = client.get_activity_streams(activity,
types=types, series_type='time')
return streams
def DataFrame(dict, types):
# Converts a Stream into a dataframe, and returns the dataframe
# print(dict, types)
df = pd.DataFrame()
for item in types:
if item in dict.keys():
df.append(item.data)
df.fillna('', inplace=True)
return df
def ParseActivity(act, types):
act_id = act.id
name = act.name
# print(str(act_id), str(act.name), act.start_date)
streams = GetStreams(client, act_id, types)
df = pd.DataFrame()
# Write each row to a dataframe
for item in types:
if item in streams.keys():
df[item] = pd.Series(streams[item].data, index=None)
df['act_id'] = act.id
df['act_startDate'] = pd.to_datetime(act.start_date)
df['act_name'] = name
return df
def convMs2Kmh(speed):
# Convert m/s in km/h
return speed / 1000 / (1 / 3600)
def prepareOneActivity(my_data, dir):
# Prepare the heartrate data for barplot
counts = [0, 0, 0, 0, 0]
data = my_data['heartrate']
for point in data:
if (point < 137):
counts[0] += 1
elif (point >= 137 and point < 151):
counts[1] += 1
elif (point >= 151 and point < 165):
counts[2] += 1
elif (point >= 165 and point < 172):
counts[3] += 1
elif (point > 179):
counts[4] += 1
tmp = counts
total = sum(tmp)
counts = [(1. * x / total) * 100 for x in tmp]
# Prepare the various data for boxplots
hfrq_by_zones = [[], [], [], [], []]
cadz_by_zones = [[], [], [], [], []]
velo_by_zones = [[], [], [], [], []]
my_list = list()
my_list.append(list(my_data['heartrate']))
my_list.append(list(my_data['velocity_smooth']))
if ('cadence' in my_data):
my_list.append(list(my_data['cadence']))
else:
my_list.append([0] * my_data['velocity_smooth'])
my_array = zip(*my_list)
for hr, vs, cd in my_array:
vs = convMs2Kmh(vs)
if (hr < 137):
hfrq_by_zones[0].append(hr)
cadz_by_zones[0].append(cd)
velo_by_zones[0].append(vs)
elif (hr >= 137 and hr < 151):
hfrq_by_zones[1].append(hr)
cadz_by_zones[1].append(cd)
velo_by_zones[1].append(vs)
elif (hr >= 151 and hr < 165):
hfrq_by_zones[2].append(hr)
cadz_by_zones[2].append(cd)
velo_by_zones[2].append(vs)
elif (hr >= 165 and hr < 172):
hfrq_by_zones[3].append(hr)
cadz_by_zones[3].append(cd)
velo_by_zones[3].append(vs)
elif (hr > 179):
hfrq_by_zones[4].append(hr)
cadz_by_zones[4].append(cd)
velo_by_zones[4].append(vs)
# -----------------------------------------------------------------------------
# Prepare bar plot of number of values in the zone
# -----------------------------------------------------------------------------
objects = ('S', 'GA1', 'GA2', 'EB', 'SB')
y_pos = np.arange(len(objects))
plt.figure()
plt.bar(y_pos, counts, align='center', alpha=0.5)
plt.xticks(y_pos, objects)
plt.ylabel('Percentage of activity')
plt.xlabel('Zones')
plt.title('Heartrate Zones')
plt.ylim([0, 100])
plt.savefig(dir + '/' + '1.png')
# -----------------------------------------------------------------------------
# Prepare the bar plot combined with boxplot of velocity & cadence
# -----------------------------------------------------------------------------
data_len = [int(i) for i in counts]
plt.figure()
host = host_subplot(111, axes_class=AA.Axes)
plt.subplots_adjust(right=0.75)
ax2 = host.twinx()
ax3 = host.twinx()
offset = 60
new_fixed_axis = ax3.get_grid_helper().new_fixed_axis
ax3.axis["right"] = new_fixed_axis(loc="right", axes=ax3,
offset=(offset, 0))
ax2.axis["right"].toggle(all=True)
ax2_min = -100
ax2_max = 175
ax3_min = 0
ax3_max = 100
host.set_ylim([0, 100])
ax2.set_ylim([ax2_min, ax2_max])
ax3.set_ylim([ax3_min, ax3_max])
host.set_xlabel("Zones")
host.set_ylabel("Percentage of activity")
ax2.set_ylabel("Cadence")
ax3.set_ylabel("Velocity")
host.bar(range(1, len(data_len) + 1), data_len, align='center',
color="lightgrey")
bp1 = ax2.boxplot(cadz_by_zones, widths=0.6)
bp2 = ax3.boxplot(velo_by_zones, widths=0.6)
ax2.axis["right"].label.set_color("red")
ax3.axis["right"].label.set_color("blue")
host.set_xticklabels(objects, rotation='vertical')
# major ticks every 20, minor ticks every 5
ax2_major_ticks = np.arange(ax2_min, ax2_max, 20)
ax2_minor_ticks = np.arange(ax2_min, ax2_max, 5)
ax2.set_yticks(ax2_major_ticks)
ax2.set_yticks(ax2_minor_ticks, minor=True)
ax3_major_ticks = np.arange(ax3_min, ax3_max, 20)
ax3_minor_ticks = np.arange(ax3_min, ax3_max, 5)
ax3.set_yticks(ax3_major_ticks)
ax3.set_yticks(ax3_minor_ticks, minor=True)
for box in bp1['boxes']:
box.set(color='red', linewidth=1)
for box in bp2['boxes']:
box.set(color='blue', linewidth=1)
plt.savefig(dir + '/' + '2.png')
# -----------------------------------------------------------------------------
# Setup
# -----------------------------------------------------------------------------
plt.figure()
fig, axes = plt.subplots(nrows=1, ncols=2, figsize=(9, 4))
bplot1 = axes[0].boxplot(hfrq_by_zones, vert=True, patch_artist=True)
bplot2 = axes[1].boxplot(data, vert=True, patch_artist=True)
colors = ['pink', 'lightblue', 'lightgreen']
for bplot in (bplot1, bplot2):
for patch, color in zip(bplot['boxes'], colors):
patch.set_facecolor(color)
axes[0].yaxis.grid(True)
axes[1].yaxis.grid(True)
axes[0].set_xticks([y + 1 for y in range(len(hfrq_by_zones))], )
axes[0].set_xlabel('Zones')
axes[0].set_ylabel('Heartrate')
axes[0].set_ylim([100, 230])
axes[1].set_ylim([100, 230])
plt.setp(axes[0], xticks=[y + 1 for y in range(len(hfrq_by_zones))],
xticklabels=objects)
plt.setp(axes[1], xticks=[1],
xticklabels=["All"])
# -----------------------------------------------------------------------------
# Display the plot windows
# -----------------------------------------------------------------------------
plt.savefig(dir + '/' + '3.png')
class MyHandler2(http.server.BaseHTTPRequestHandler):
# Handle the web data sent from the strava API
allDone = False
data = {}
def do_HEAD(self):
return self.do_GET()
def do_GET(self):
# Get the API code for Strava
# self.wfile.write('<script>window.close();</script>')
code = urllib.parse.parse_qs(
urllib.parse.urlparse(self.path).query)['code'][0]
# Login to the API
client = UseCode(code)
# Retrieve the last limit activities
activities = GetActivities(client, limit)
for item in activities:
print(item.name)
# Loop through the activities, and create a dict of the dataframe
# stream data of each activity
print("looping through activities...")
df_lst = {}
for act in activities:
df_lst[act.start_date] = ParseActivity(act, types)
MyHandler2.data = df_lst
MyHandler2.allDone = True
# -----------------------------------------------------------------------------
# *** Run Section ***
# -----------------------------------------------------------------------------
# -----------------------------------------------------------------------------
# Request access via local browser
# -----------------------------------------------------------------------------
client_id, secret = open('client.secret').read().strip().split(',')
# Create the strava client, and open the web browser for authentication
client = stravalib.client.Client()
authorize_url = client.authorization_url(client_id=client_id, redirect_uri=url)
print('Opening: %s' % authorize_url)
webbrowser.open(authorize_url)
# -----------------------------------------------------------------------------
# Start webserver and wait for redirect local browser
# -----------------------------------------------------------------------------
httpd = http.server.HTTPServer(('localhost', port), MyHandler2)
while not MyHandler2.allDone:
print(MyHandler2.allDone)
httpd.handle_request()
# -----------------------------------------------------------------------------
# Data preparation
# -----------------------------------------------------------------------------
# if os.path.exists(out_dir):
#    os.remove(out_dir)
os.makedirs(out_dir)
html_str = """
<table border=1>
<tr>
<th>Name</th>
<th>1</th>
<th>2</th>
<th>3</th>
</tr>
<indent>
"""
name_counter = {}
for act in iter(MyHandler2.data.values()):
if (len(act['act_name']) > 0 and ('heartrate' in (act))):
if act['act_name'][0] in name_counter:
name_counter[act['act_name'][0]] += 1
act['act_name'][0] = act['act_name'][0] + str(name_counter[
act['act_name'][0]])
else:
name_counter[act['act_name'][0]] = 0
for act in iter(MyHandler2.data.values()):
if (len(act['act_name']) > 0 and ('heartrate' in (act))):
print(act['act_name'][0])
os.makedirs(out_dir + '/' + act['act_name'][0])
prepareOneActivity(act, out_dir + "/" + act['act_name'][0])
html_str += "<tr><td>" + str(act['act_name'][0]) + "</td>"
html_str += '<td><image src="' +  './' + act['act_name'][0] + '/1.png' + '"/></td>'
html_str += '<td><image src="' +  './' + act['act_name'][0] + '/2.png' + '"/></td>'
html_str += '<td><image src="' +  './' + act['act_name'][0] + '/3.png' + '"/></td>'
html_str += """
</indent>
</table>
"""
Html_file = open(out_dir + '/' + "report.html", "w")
Html_file.write(html_str)
Html_file.close()
webbrowser.open(out_dir + '/' + "report.html")
Conclusion – Analyze Strava Training Activities
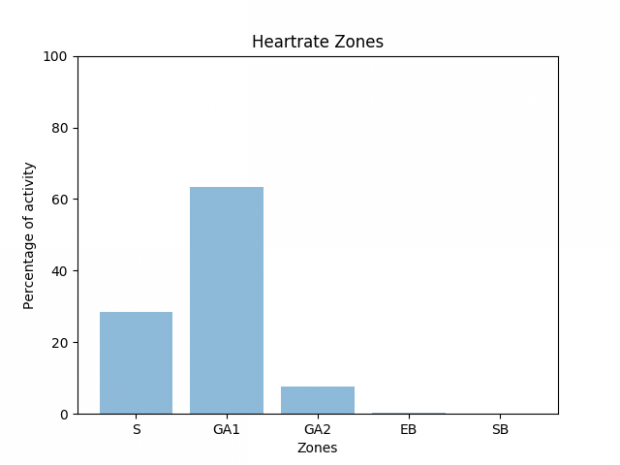
With the generated diagrams at hand, I can check if my training was effective. I found out, that if I set the alarms to the basic endurance 1 limits, I end up in 60% BA1 and nearly 40% BA2. So I updated the heart rate alert, dropping the upper limit one a little bit. That way I get notified earlier and can adapt to it before the I leave the zone.
The heart rate box plots confirm the information gained from the zone distribution. If heart rate alarms are set exactly, the third quartile is placed much higher and fourth quartile much smaller. I didn’t found a pattern in the cadence & velocity data yet.
Analyze Strava training was the goal. With this little helper, I can analyze Strava training data and optimize my training. I hope, you can use the code for your projects too. Again, you can find the complete code on https://github.com/marquies/strava-viz.